
Quick start: the dashboard
Mail Log works immediately after the installation. This page shows how to produce the first entry and how to read the dashboard properly.
Producing the first entry
Send any email through your website — easiest is the built-in test email under System → Global Configuration → Server → Send Test Mail. Then open Components → Mail Log. The message appears as the most recent entry.
Reading the dashboard
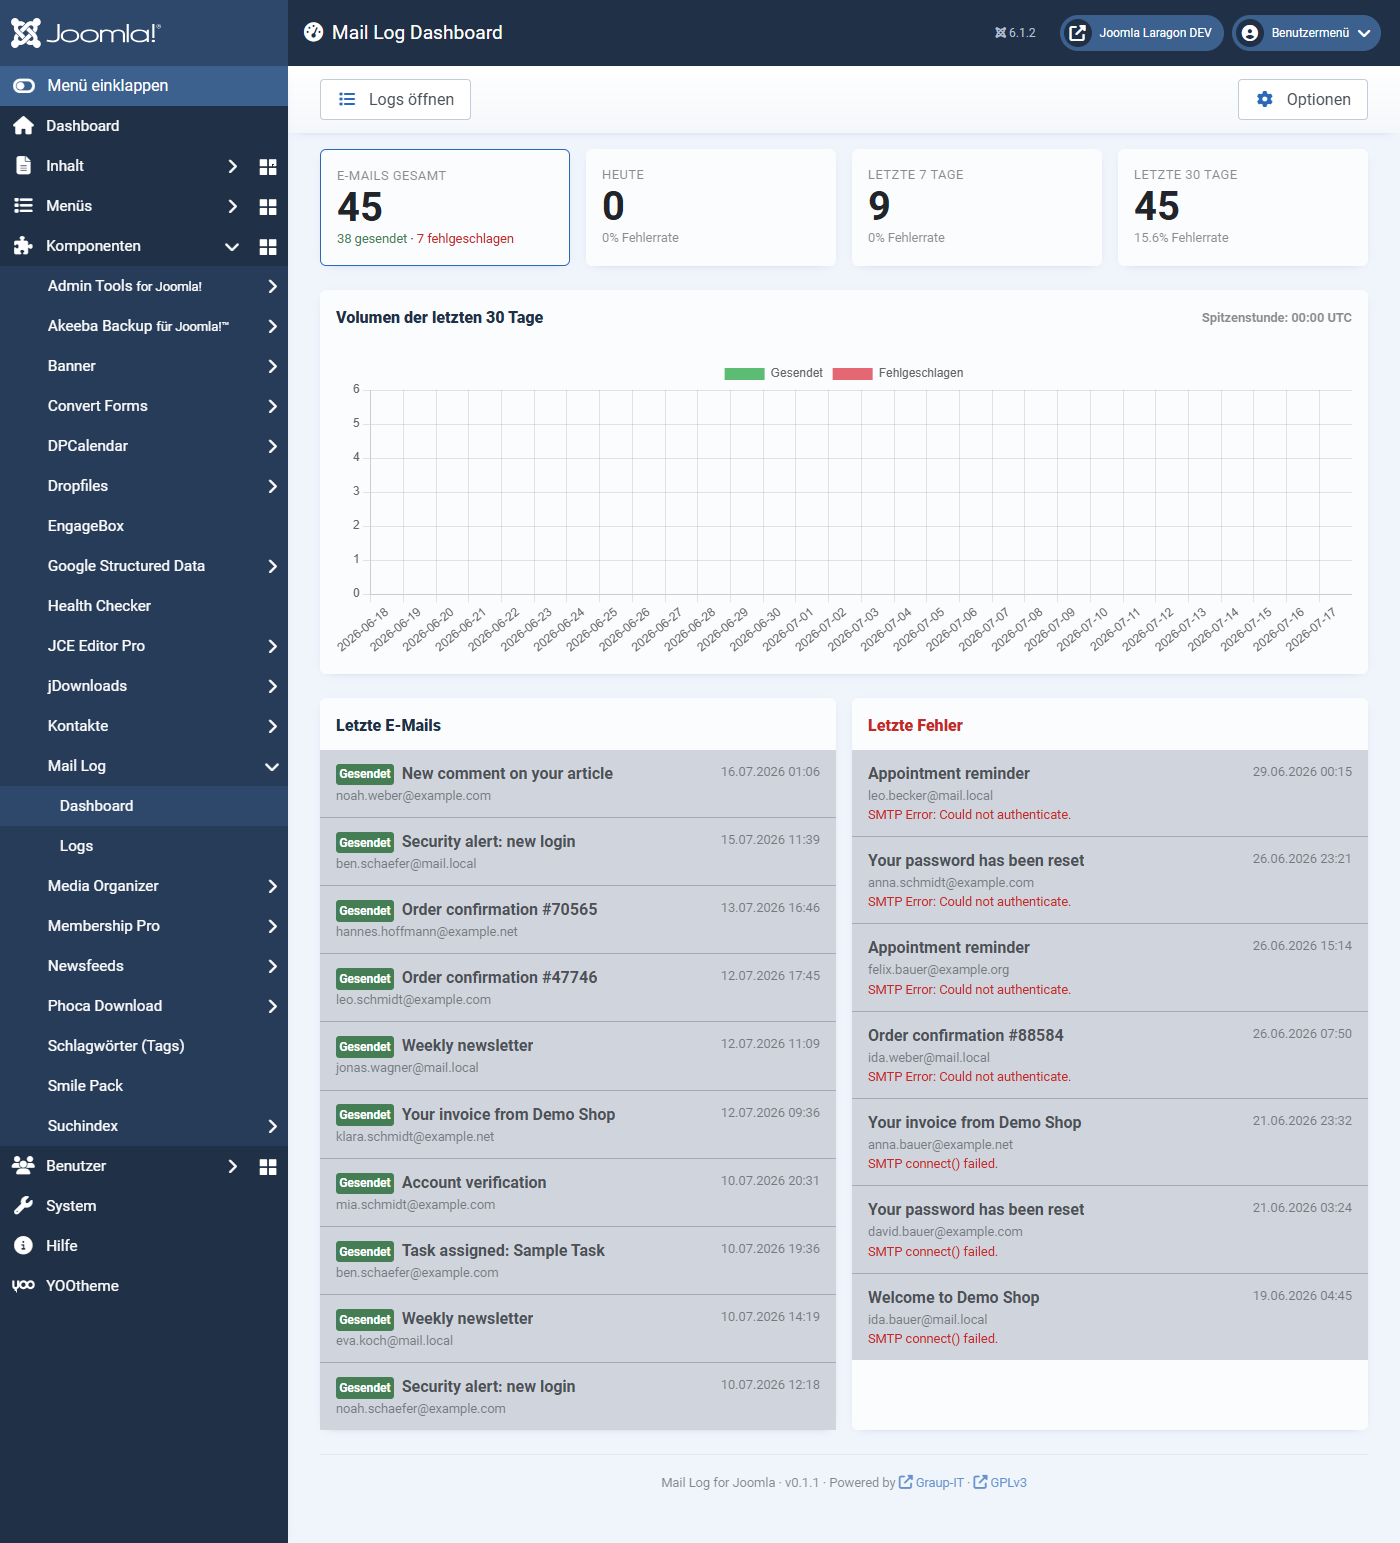
At the top there are four key figures:
| Tile | Meaning |
|---|---|
| Emails in total | All logged mails, broken down into sent and failed. |
| Today | Mails of the current day with error rate. |
| Last 7 days | Weekly figure with error rate. |
| Last 30 days | Monthly figure with error rate. |
Below them follow:
- The activity chart — sent and failed mails per day, stacked. Above the chart the peak hour of the period is shown.
- Latest emails — the most recent messages with status, subject and sender. One click opens the detail view.
- Latest errors — the most recent failed deliveries, so that you see problems immediately.
If the chart does not render (with JavaScript switched off, for instance), Mail Log shows the same figures as a table automatically. No information is lost.
Where to go from here
Applies to version 1.0.4.